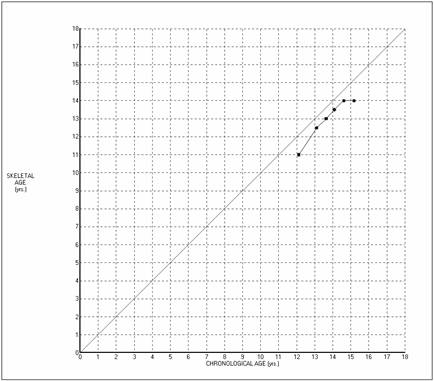
Pedipod/LLD shows the relationship between skeletal age and chronological age in two different ways. These graphs can be used to assess this relationship and can also be used to assess the consistency and accuracy of skeletal age estimations. The curve shown in these graphs should be relatively smooth. Jagged ups and downs suggest errors in estimating skeletal age and suggest a review of the skeletal age films.
This graph shows skeletal age plotted against chronological age.
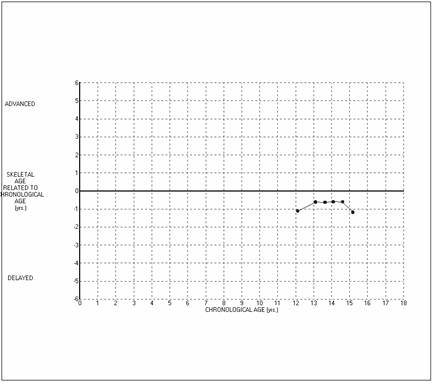
This graph shows the difference between skeletal and chronological age plotted against chronological age. This graph makes it clear if the patient’s skeletal age has been advanced or retarded.
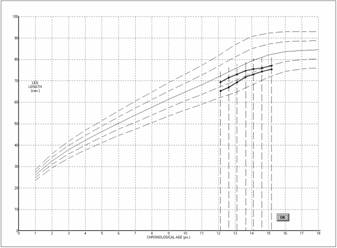
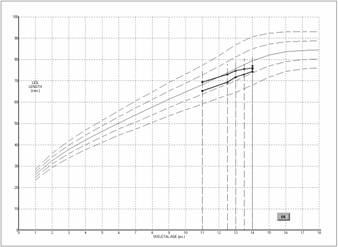
In these graphs Pedipod/LLD shows the patient’s leg lengths plotted over the data of the Boston Growth Study. Lines representing the means and one and two standard deviations above and below the mean in that study are shown.
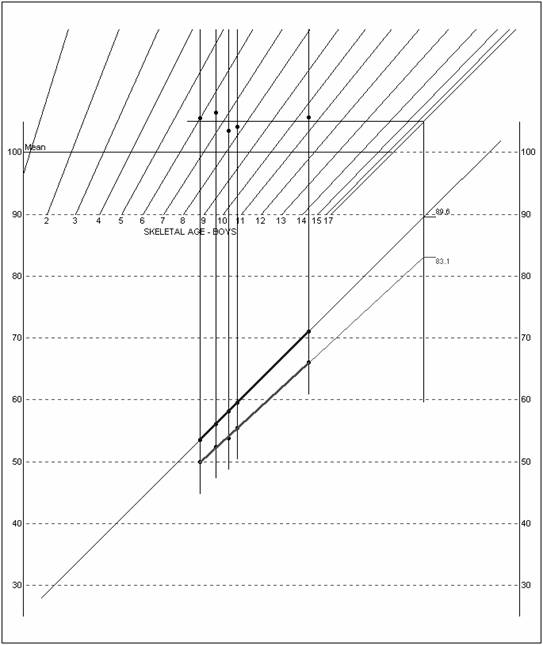
Pedipod/LLD shows the Straight Line Graph. In certain ways the computerized version of the Straight Line Graph is more versatile than the paper version since the computer can do things that the surgeon cannot do in his head.
Pedipod/LLD plots the points for skeletal age exactly as the user of the paper version of the Straight Line Graph method would, except that only the skeletal age lines for the appropriate sex are shown. When it comes to placing the horizontal straight line representing the patient’s growth percentile, however, the computer gives more weight to recent skeletal age estimates than to earlier ones.
The paper version is a method of pre-operative analysis . In contrast, Pedipod/LLD is a general tool for the representation and analysis of growth of the legs.
Pedipod/LLD plots the points for leg length exactly as the user of the paper version would for points prior to any surgery. The paper version provides no way to depict the effect of surgery, plot points after epiphysiodesis, or make predictions once surgery has been performed, but Pedipod/LLD has all of these capabilities.
Pedipod/LLD represents lengthenings by vertical lines and epiphysiodeses by changes in the slope of the growth line of the long leg. Thick lines represent past growth, and thin lines represent the predictions of future growth. The lengths of both legs at maturity are labeled.
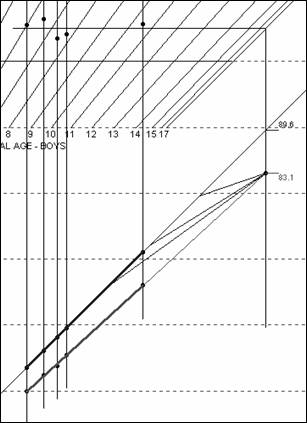
This graph shows the predicted effects of epiphyseodeses done at the appropriate times to provide perfect correction with a goal of exactly equal leg lengths
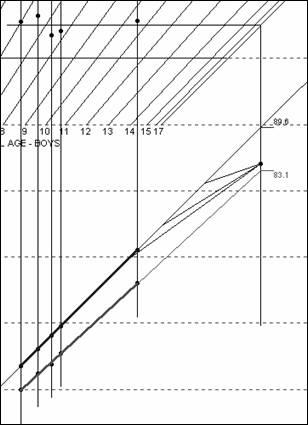
In this case a goal of undercorrection by 1 cm. Has been selected. The graph shows the predicted effects of epiphyseodeses done at the appropriate time to provide perfect correction with respect to that target.
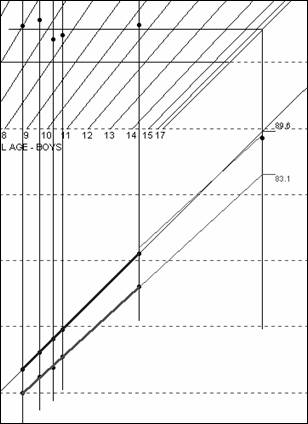
This graph shows the predicted effect of a lengthening of 6.0 cm., slightly more than the present discrepancy, but slightly less than the discrepancy predicted at maturity. The growth line of the short leg is elevated on the graph by 6.0 cm. but maintains the growth rate of the short leg. Thus, the short leg becomes temporarily the long leg, but later gets overtaken by the long leg.
|
Web site problems or suggestions? Send an email
|